
The stock market trend analysis and Technical analysis strategy known as trend analysis makes an effort to predict future stock price movements using trend data that has recently been observed. The long-term direction of market sentiment can be predicted using trend analysis, which makes use of previous data such as price changes and trade volume.
Table of Contents
Key Points of share market trend analysis:
- The aim of trend analysis is to predict a trend, like a bull market run, and then follow that trend until it leads to a trend reversal, like a bull-to-bear market.
- To make it easier for traders to predict what will happen in the future, trend analysis is predicated on the idea that past events can provide insight into the present.
- Focus is placed on the short-, intermediate-, and long-term time periods in trend analysis.
Identifying The Stock Market Trends:
Stock market trend analysis indicate the general direction that a particular stock, an industry, or the market as entire is moving. Identifying possible opportunities and risks for investors is made easier through trend analysis. Stocks have a tendency to move in a specific direction over time, which is the primary principle of trend research. These directions are frequently categorised as:
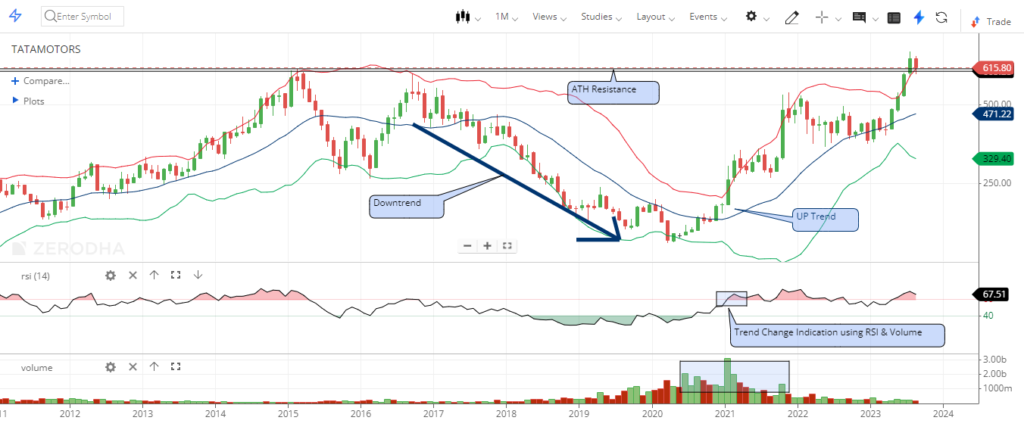
1. Uptrend:
when the stock price increases gradually over a long period of time.

2. Downtrend:
when the stock price continually decreases over a long period of time.
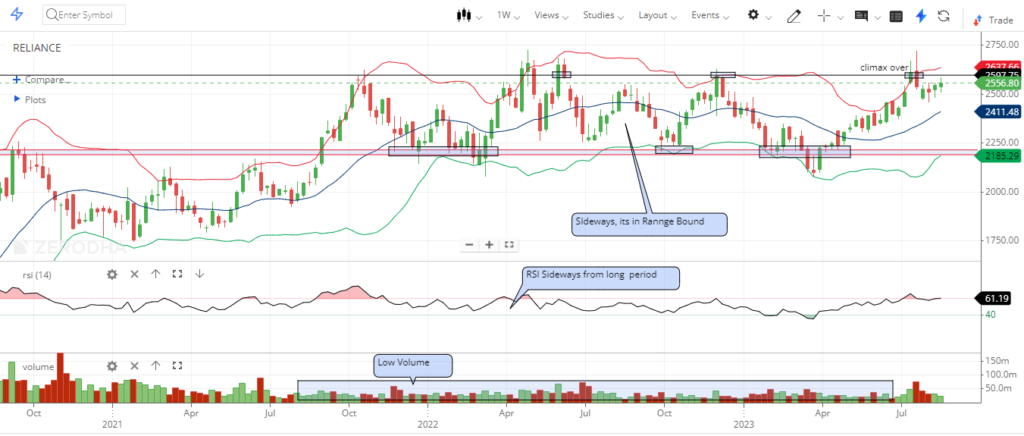
3. Sideways:
when there is not an upward or downward trend and the stock price fluctuates in a very narrow range.
Why is Share Market Trend Analysis important?
Risk Mitigation:
In order to control and decrease the risks involved with their investments, investors can identify trends. For example, it can be advisable to review or cut your losses if a stock is going through a sharp decline.
Profit Maximization:
Profits may be huge by taking advantage of trends. An investor can maximise their returns by buying low and selling high if they properly predict the trend and follow it.
Informed Decision making:
In order to make good decisions, investors might benefit from trend analysis. It helps answer questions such as when to buy, when to sell, or when to hold an investment.
Methods of Stock Market trend Analysis?
Technical Analysis:
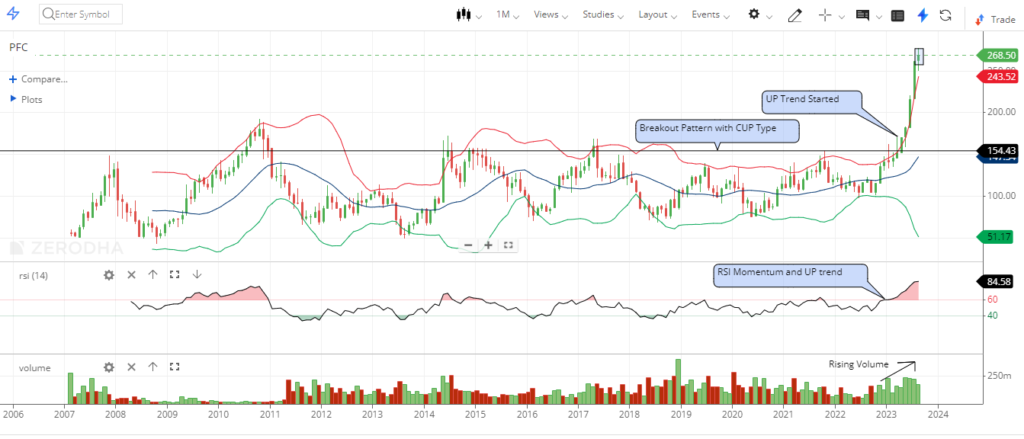
Stock market trend analysisis the best tool for stock market world. Technical analysis is the process of predicting future price movements using historical price and volume data. Trendlines, moving averages, and numerous technical indicators like the Relative Strength Index (RSI) and Moving Average Convergence Divergence (MACD) are important indicators in technical analysis.
Fundamental Analysis:
Based on financial data, economic indicators, and sector analysis, this fundamental analysis (strategy) determines a stock’s value. While it may not be able to forecast trends directly, it can offer information about a stock’s long-term prospects.
Sentiment Analysis:
This includes assessing the sentiment of the market by news, social media, and other sources. Extreme emotion may be an indication of future trend reversals.
Key Indicators in Trend Analysis:
Moving Averages:
stock market trend analysis is identified by using moving averages.Moving averages make price data over a given period more consistent, which makes it simpler to see trends. Common moving averages are the 20-day ,50-day, 150-day and200-day moving averages.
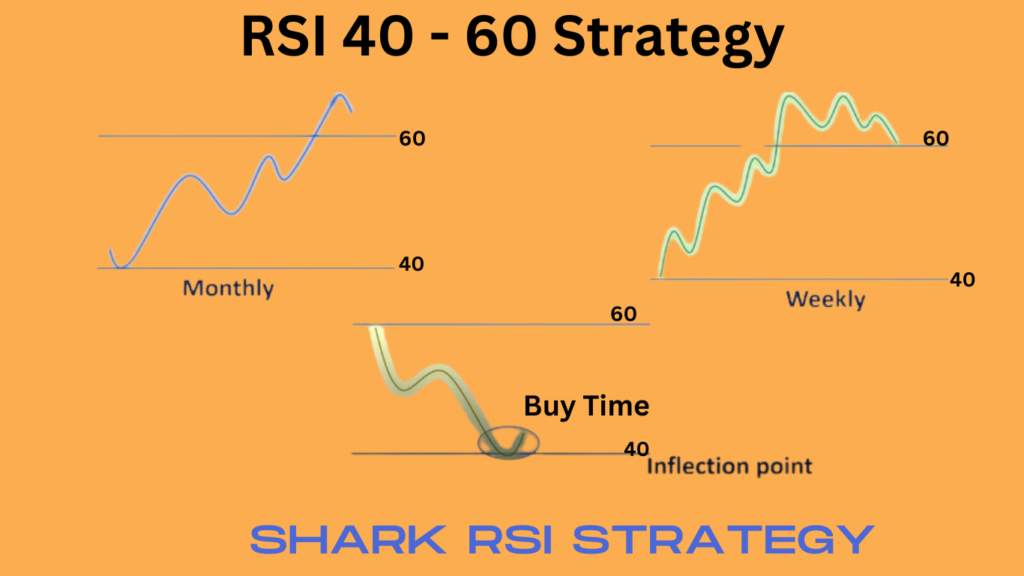
Relative Strength Index(RSI):
The RSI measures how quickly and regularly prices change. It is used to identify overbought or oversold situations that can predict trend reversals.
MACD:
The Moving Average Convergence Divergence is an indicator for identifying changes in a trend’s intensity, direction, movement, and stability.
Support and Resistance Levels:
These are the price ranges where a stock is most likely to stop selling and turn around. Finding these levels may help in predicting future trend reversals.
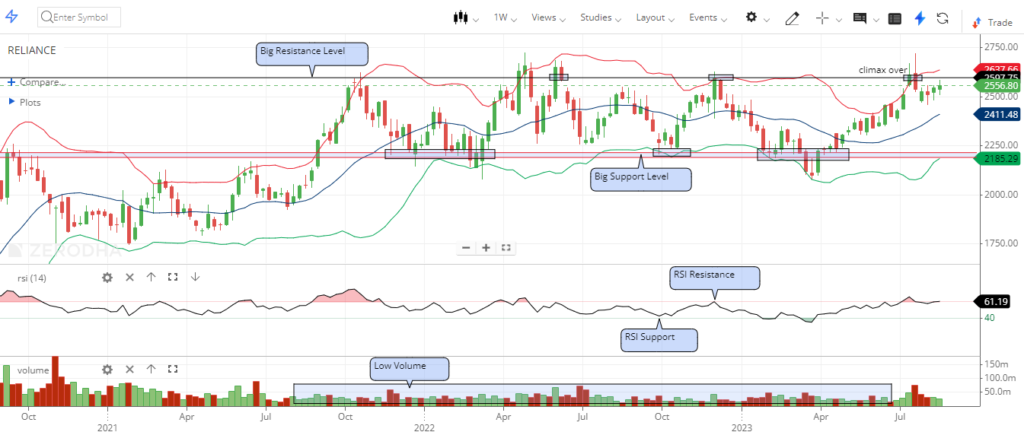
Volume Analysis:
Analysing trading volume together with price changes might reveal information about how strong a trend is. A trend is frequently confirmed by rising volume, whereas falling volume may indicate a trend reversal.
Stock Market Trend Analysis in Practise:
Take into account the following actions to effectively execute stock market trend analysis:
Selecting Stocks:
stock market trend analysis identify the stock is uptrend or downtrand then we can choose best stocks. Start by selecting stocks or investments that are consistent with your risk tolerance and investing objectives.
Data Collection:
Obtain past pricing information and important indications for the asset of your choice.
Analysis:
To determine the current trend and possible entry and exit points, use technical, fundamental, or sentiment analysis.
Risk Management:
Use risk management techniques to reduce possible losses, such as placing stop-loss orders.
Continuous Monitoring:
Keep a close watch on your investments at all times and modify your plan as the market demands.
You Can Read This Articles As Well:
- Fundamental Analysis of particular stocks
- Best Stocks to Trade in stock market
- What is The Best Indicator for option Trading: Your key to Success
- Future and OptionsTrading
Conclusion:
For investors looking to understand the complexities of financial markets, stock market trend research is a priceless instrument. You can make smart financial choices by understanding various trends, analytical techniques, and important indicators. Keep in mind that trend analysis is not always accurate and that investing always involves some risk. However, you can improve your probability of success in the stock market by thorough research and risk management. To maximise your investments, remain knowledgeable, persistent, and continue to analyse such trends.


4 Comments on “Stock market trend analysis? share market trend analysis with examples?”