
Nifty and Banknifty:In the dynamic world of trading, staying informed about market trends is paramount. As we delve into this week’s technical analysis of Nifty and Banknifty, we’ll examine crucial indicators and patterns that can help traders make informed decisions. By analysing daily, hourly, and monthly trends, we aim to provide valuable insights into the current market conditions.
Table of Contents
What is Nifty and Banknifty?
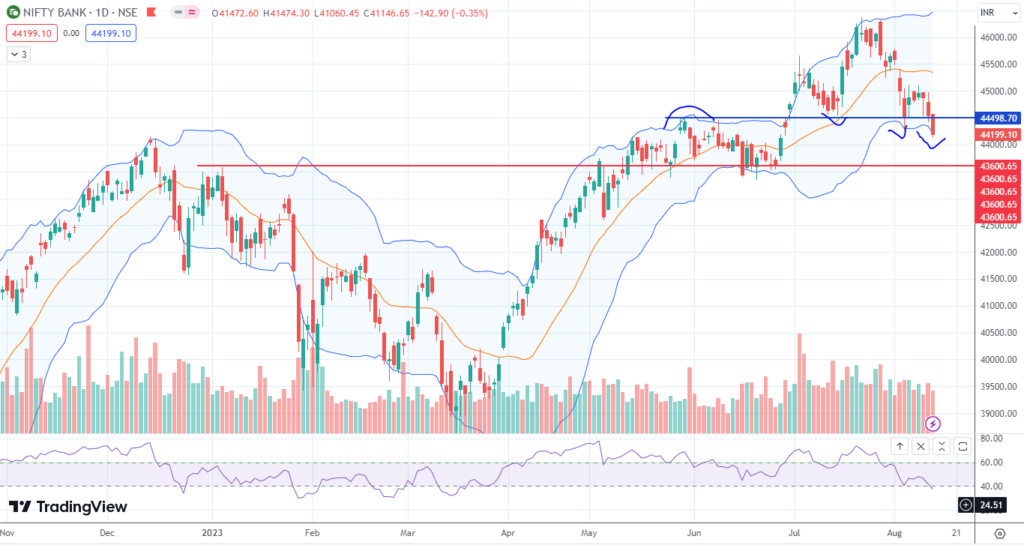
The standard index known as Bank Nifty captures the performance of the Indian banking sector. It includes of the most liquid and frequently traded banking stocks listed on the National Stock Exchange (NSE). Bank Nifty is frequently used by traders and investors to assess the performance of the banking industry overall and to direct their trading decisions.
Market Overview:Nifty and Banknifty
As of now, the market conditions are exhibiting a mix of signals across different timeframes. Let’s break down the analysis based on daily, hourly, and monthly perspectives.
Daily Analysis: RSI Momentum is sideways
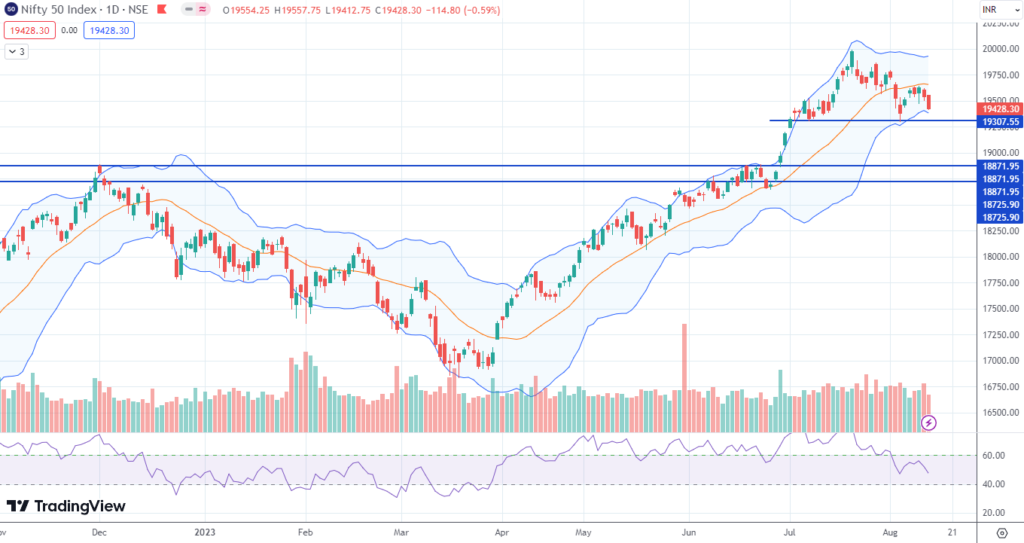
The Relative Strength Index (RSI) is a crucial tool for assessing the momentum of an asset. In the daily timeframe, we observe that the RSI has been moving sideways. This suggests that the market is currently lacking a clear directional bias on a daily basis. Sideways RSI values indicate a balance between buying and selling pressures. Traders should be cautious when making short-term trades, as the lack of a strong trend might lead to choppy price movements.
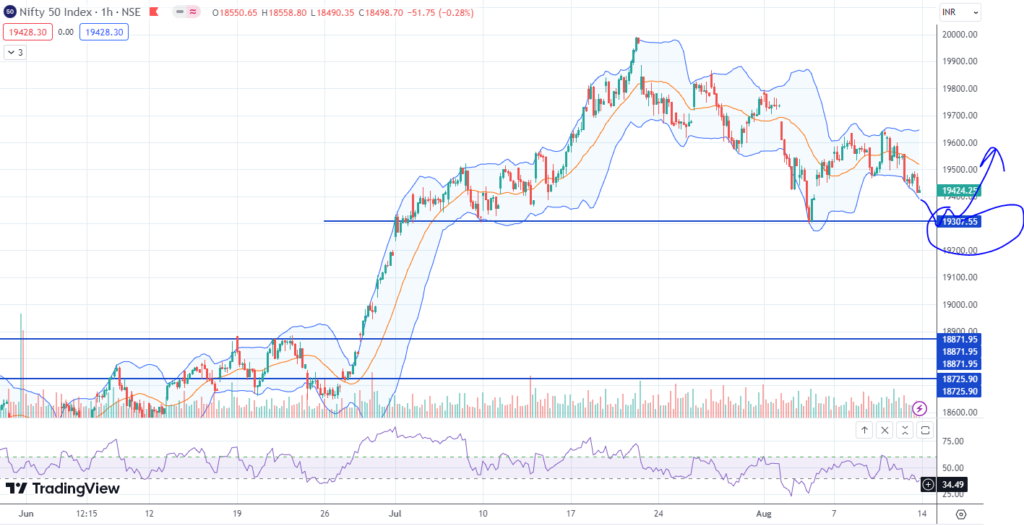
Hourly Analysis: Short-Term Momentum Down Trend:
Zooming in to the hourly chart, we notice that the short-term momentum is skewed towards a downtrend. This could be due to various factors, including profit-taking, news events, or temporary shifts in market sentiment. It’s important to note that hourly trends can be more volatile, so traders looking for short-term opportunities should be cautious and consider utilizing risk management strategies.

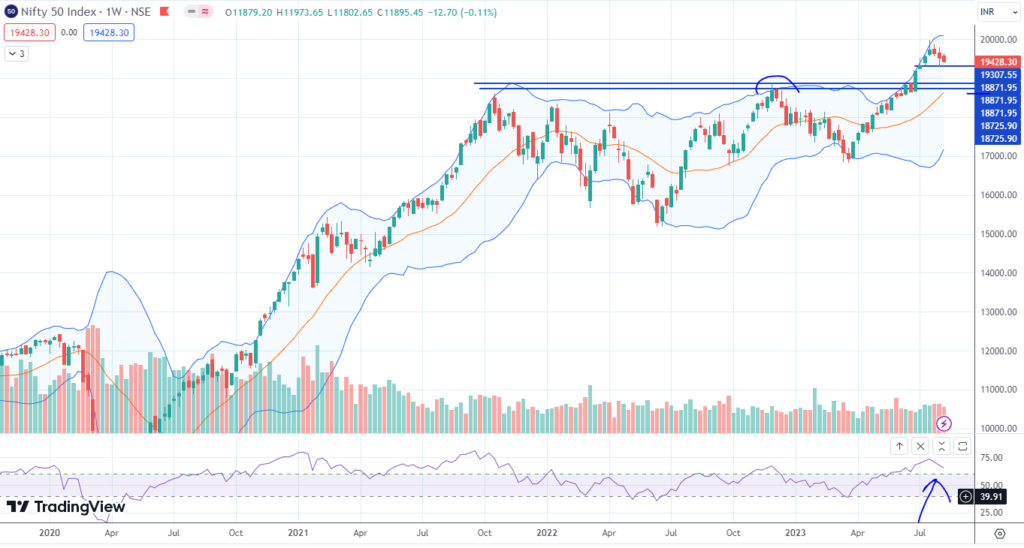
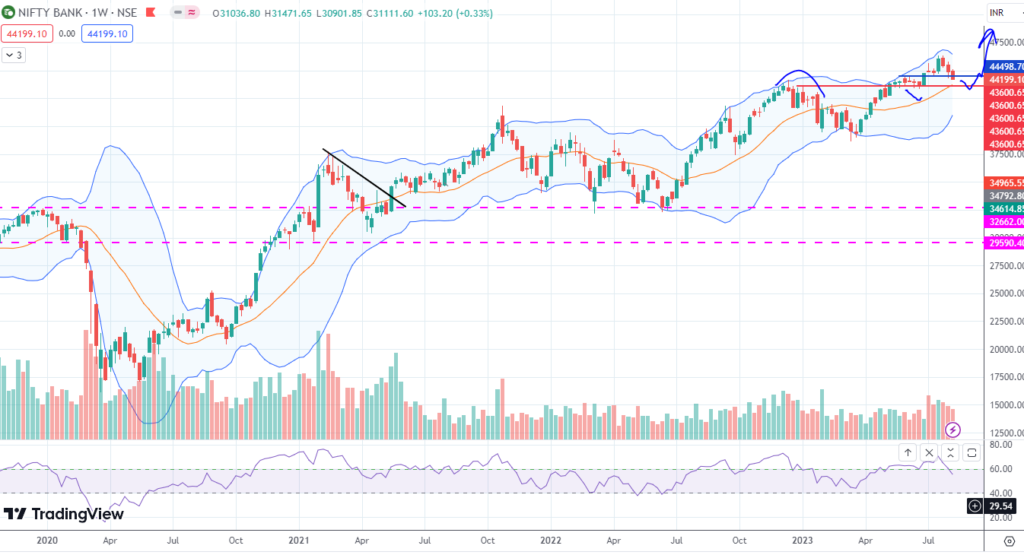
Strong Uptrend in Weekly & Monthly Analysis:
Nifty and Banknifty:The weakly & monthly chart depicts a robust rising on a larger scale. The longer-term market trend is still bullish despite the short-term swings and sideways daily RSI and daily formed a flag pattern. This suggests that despite near-term concerns, the market is demonstrating resilience. Longer-term investors who trade may find opportunities to profit from the upward trend, but they need still watch out for potential short-term downtrends.
Major Levels of Support and Resistance:Nifty and Banknifty
Effective trading requires being able to recognise critical levels of support and resistance. The levels are frequently used by traders to determine their entry and exit locations. Observing these levels in the case of Nifty and Bank Nifty can reveal important information:
Support for Nifty: 19000
Resistance for Nifty: 19650
Bank Nifty Support : 43500
Bank Nifty Resistance: 44600
Summery:Nifty and Banknifty
Nifty and Banknifty:The current market conditions offer a mix of signals across different timeframes. The daily RSI suggests sideways movement, the hourly trend leans towards a short-term downtrend, while the monthly perspective maintains a strong uptrend. Traders should approach the market with caution, considering the nuances of each timeframe. For short-term traders, the hourly downtrend warrants careful planning and risk management. Long-term investors can take advantage of the overall bullish trend indicated by the monthly chart. However, all traders must remain flexible and adaptive to changing market conditions, news events, and other variables that can impact trading outcomes. Remember, successful trading requires a comprehensive approach that integrates technical analysis, fundamental insights, risk management, and a solid trading plan. By staying informed and keeping a close eye on the evolving market trends, traders can navigate the dynamic landscape with confidence.


Fantastic article! The information you provide is important. Thank you for sharing!