
Finding the best indicator for option trading is equivalent to finding the secret key to financial success when it comes to navigating the complicated world of options trading. Experienced traders are aware that the right indication can act as your direction as they navigate the volatile market. In this thorough guide, we’ll explain what options trading indicators are and help you in finding the most effective one, ensuring that your journey is both profitable and well-informed.
Table of Contents
What is Option trading?
Before going to discuss of best indicator for option trading, we will learn about the option trading. Options are a type of financial derivative that gives investors an individual opportunity to buy or sell an underlying asset at a fixed price (strike price) before or on a specific date (expiration date) without having to pay a premium. Options are used by traders for a number of reasons, including speculating, hedging, and generating money.
Basics of Option Trading?
Two types of Options:
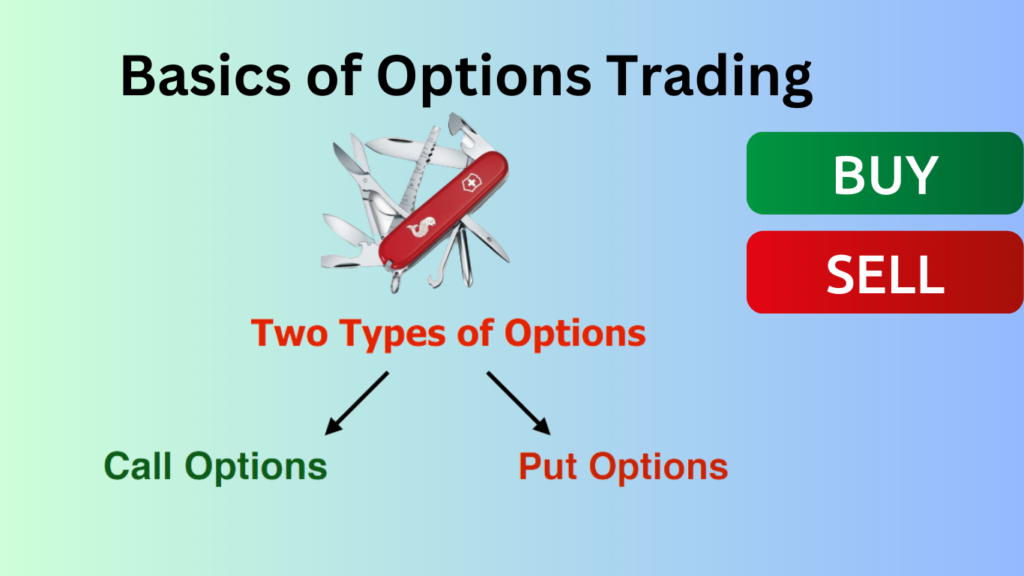
Call Option:
A contract that gives the buyer the Right to Buy Lot of Shares of a Stock at a specific Strike Price on/before an Expiration Date
Put Option:
A Put Option is a contract that gives the buyer the Right to Sell Lot of shares at a Strike Price on/before an Expiration Date

Importance of the Best indicator for Option Trading:
Indicators operate as the traders’ guides in the field of options trading. They provide priceless information on market patterns, possible price changes, and the best times to enter or exit a contract. But with so many indications at your disposal, it’s important to choose the one that best suits your trading approach and is the best indicator for option trading.
Relative Strength Index(RSI): Its a Momentum Indicator
A effective trading indicator is the Relative Strength Index (RSI). It measures how quickly and sharply prices move, giving traders important details. With an RSI that ranges from 0 to 100, it’s simple to see overbought and oversold conditions (RSI over 70 and below 30, respectively).
When the RSI rises above 70 or falls below 30, you should wait a while before making a decision in order to minimise the risk.
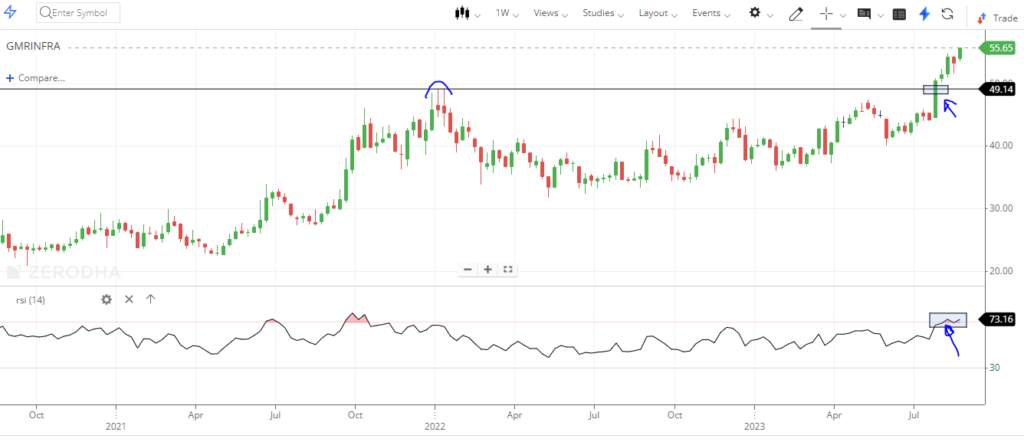
Best indicator for option trading showing above Chart highlights Showing that RSI is crossing above 70 and same time Stock chart also crossing previous resistance leves, then what we observed is Stock came into momentum. But every one will think that the stock is over bought and its comes down. This is a wrong psychology.
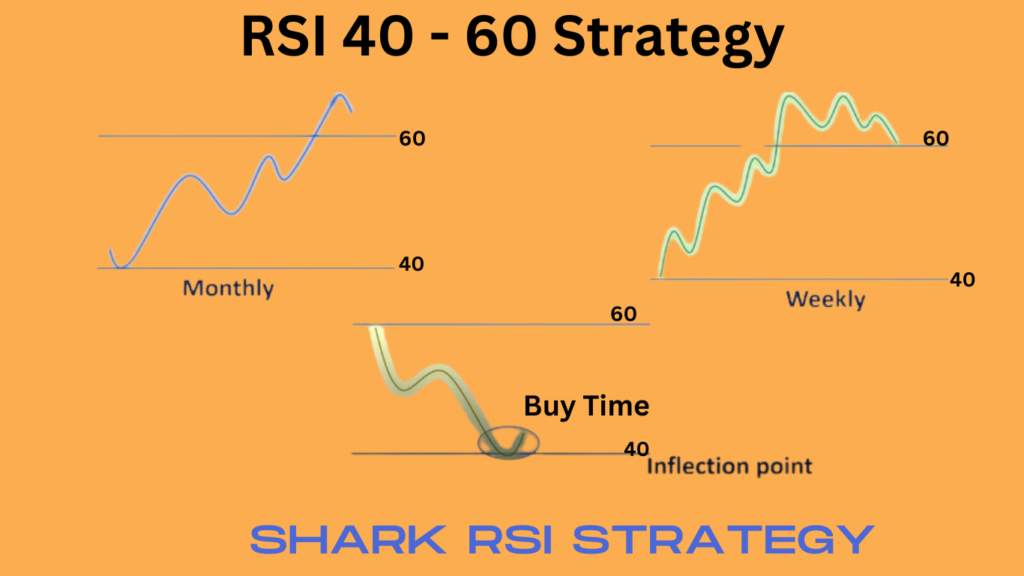
As per Shark Investments RSI strategy is 40 – 60 rule(Any Time frame)
Longterm Trading Time frames : Month, weakly
Short Term Trading Time Frame : Daily Hoirly
Intraday Option Trading Time frame : 15Minutes & Hourly
Scalping Trading Time Frame: 1Minute and 5 Minutes
- RSI is below 40 means strong down trend.
- RSI is 40 – 60 between stock is in sideways
- RSI is above 60 Very bullish momentum
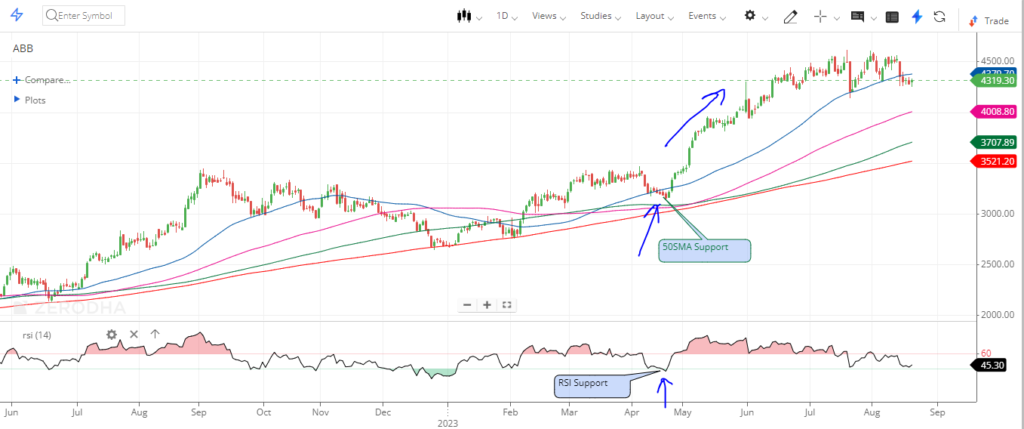
Moving Averages: Define the Direction and shows the Support and Resistance
One of the best instruments for options traders continues to be the moving average indicator, a best indicator for option trading. These indicators simplify price data while also revealing patterns that could otherwise go missed. Simple Moving Averages (SMA) and Exponential Moving Averages (EMA) are the two main varieties of moving averages that you will come across. SMAs treat all data points equally, whereas EMAs place more emphasis on recent prices.
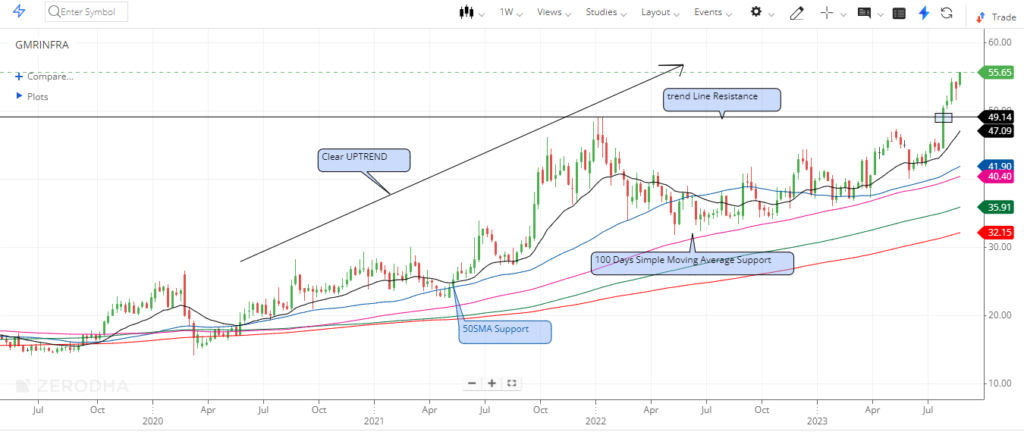
Above chart Shows trend is clear UPTREND because all moving aerages are slopping up and prices are forming higher highs and lower highs pattern. Moving averages are very very important indicator for option trading because find the support, resistance and trend. By knowing trend we can trade without issues.
Stock market trend analysis? share market trend analysis with examples?
Bollinger Bands: Shows the Volatility of Stocks
Traders can see the price volatility and probable reversal points using Bollinger Bands. Bollinger Bands, which have a middle band (SMA) and two outside bands based on standard deviations, are highly effective at identifying overbought and oversold conditions.
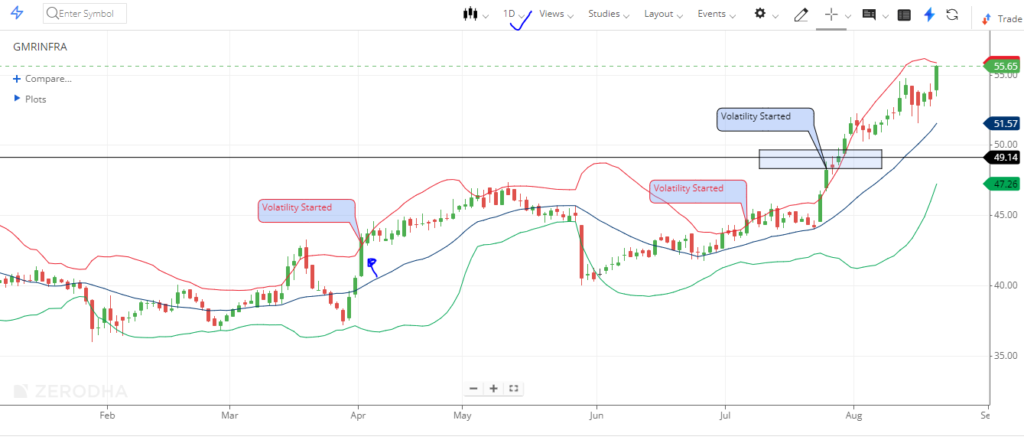
Above Image shows the volatility of particular stock when ever prices crosses above or below bands. the middle band acting as support and resistance as well as tell us volatility.
Selecting the Best indicator for option trading:
Finding the perfect tool for an artist is similar to searching for the best indicator for option trading; it’s an individual choice based on your trading style, preferences, and risk tolerance. Each indicator has particular advantages and disadvantages. In order to achieve success, you must test and improve your strategy using several indicators until you find the one that matches your objectives.
Best indicator for option trading by Shark investments is above mentioned 3 indicators. combining the all three indicators improve our confidance and success ratio also increased. below is our best indicators for options trading in india
- Simple Moving Average(SMA)
- relative Strength Index(RSI)
- Bollinger Bands(BB)
Conclusion:
As an options trader, your search for the best indicator for option trading is a vital step towards achieving success. But keep in mind that using the right instrument alone won’t guarantee your success in the market. Your skills, analysis: and adaptability are what really set you out.
- You can read Future and Options trading.
- You can read also stock Fundamental Analysis
- You can read as well Best stocks to trade
- What is volume in stock market
Frequently Asked Questions?
Can I only use a single indicator when I trade?
Although some traders do this, it’s best to use a variety of indicators for indications that are more trustworthy. we provided above three best indicators for option trading. please follow and do the back test in paper trading for 2 to 3 months, once get confidance then you can use above 3 indicators for your real trading journey.
How can I backtest indicators to get the best one for my preferences?
Best indicator for option trading has to backtest more number of time.Software for trading simulations and historical data are both useful resources for backtesting indicators.
Examples for Charting Softwares:
- Trading View
- Investing.com
- Zerodha chartig Platform
- Chart IQ
Is it possible to learn about indicators in options trading for free?
In fact, those who are interested in options trading and technical analysis can find a wide variety of online lectures, courses, and forums.You can contact us.
What’s the best time frame for using these indicators?
Depending on your trading approach, there are many best times frames. Long-term investors might choose longer time frames, but short-term traders can prefer shorter ones.
- Longterm Trading Time frames : Month, weakly
- Short Term Trading Time Frame : Daily Hoirly
- Intraday Option Trading Time frame : 15Minutes & Hourly
Is it possible to automate trading using indicator signals?
Yes, a lot of trading platforms include automation options based on predefined rules and signal indicators.


8 Comments on “Best Indicator for Option Trading: Your Key to Success”